Avoid wasting time and effort on your organizations’ ServiceNow reporting! With these ten tips and tricks for reporting, you can level up your reporting game and turn inefficiencies into strengths.
From data scoping to visualizations, use this article to iteratively improve reporting practices and create maximum-value dashboards.
Data
Data is foundational to almost every process within ServiceNow reporting. Thus, it makes an excellent starting point when you are looking to build iterative improvement.
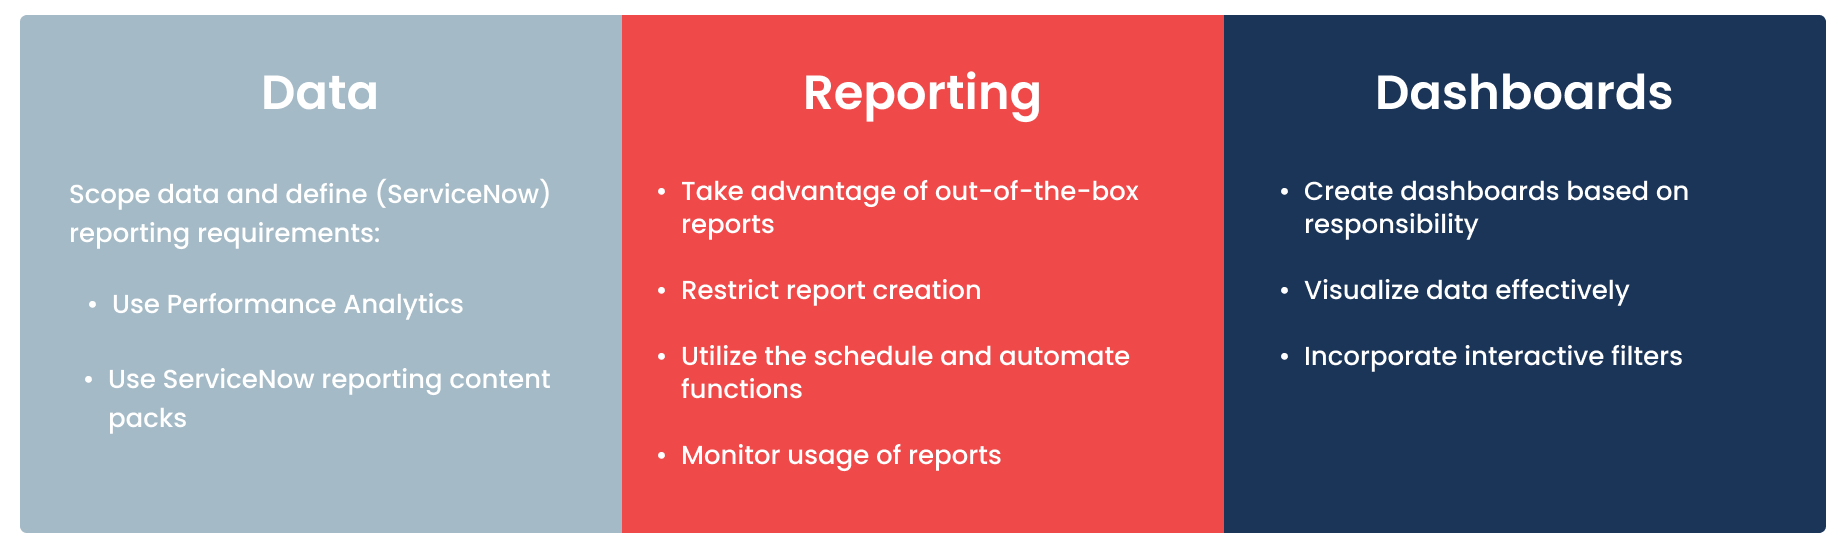
- Clearly scope data and define (ServiceNow) reporting requirements: While organizations have a virtually unlimited amount of data and information to draw upon, not all that information will translate to business value to your organization and can be counter-productive if it merely overwhelms users with unnecessary information. A good understanding of your organizations’ goals and KPIs will help you focus on the data which really matters, and the reporting that adds business value and drives development.
- Utilize Performance Analytics: PA provides advanced reporting capabilities through features such as indicators and breakdowns. This allows you to track historical data and use it to forecast the future.
- Use ServiceNow reporting content packs: ServiceNow provides a set of bundles which contain pre-made reports, dashboards in combination with other content. They serve as a quick start and can be modified to suit your business needs.
Reporting
After building up a strong foundation with data best practices, these tips can help you take the next step and build optimized reports that realize maximum value.
- Take advantage of out-of-the-box reports: Spending significant time and effort creating reports from scratch can be counter-productive when many ready-made reports already exist. Users can start with pre-built reports and customize as needed.
- Restrict report creation: ServiceNow Reporting and dashboarding should provide value to an organization. By assigning owners and roles to specific stakeholders, that can be effectively managed.
- Utilize the schedule and automate functions: Reports can be scheduled at specified times. It mitigates the need for intervention and means stakeholders can be notified of the latest updates.
- Monitor usage of reports: ServiceNow allows visibility in which reports are regularly accessed and which are proving less useful to your organization. By leveraging this information, an organization’s reporting strategy can be continually optimized.
Dashboards
Monitoring relevant data and tracking performance against established goals is easier when reporting views can be tailored to specific needs with customizable dashboards.
- Create dashboards based on responsibility: Identify the stakeholders and teams who require relevant insight. Tailor the dashboards so they can get information that is most in line with their day-to-day responsibilities.
- Visualize data effectively: Utilize the various graphical options to present data in the clearest manner. Also make sure to keep it simple to avoid clutter.
- Incorporate interactive filters: An extra layer of filtering is possible through interactive filters. Greater dynamic capabilities are unlocked allowing the user to get further insight into their data.
Use these tips to gain a leg up in ServiceNow reporting and help your organization realize the maximum amount of value from reporting. Have fun!