GenAI banner

Improve with the right analytics

Thanks to an impressive track record in implementing ServiceNow Reporting and Performance Analytics, we can provide any organization with clear insights into their ServiceNow data. All with one goal: improve your processes and digital maturity.

Male colleague in red circle

How we do it

Through a workshop approach, we link your mission and vision to Key Performance Indicators. We either use OOTB dashboards or build new dashboards based on these KPIs and then show your people how to maintain and improve the associated processes.

stepBubbles step-stippeltjes step-half-circle
01

Informative workshop

We inform you about all the possibilities regarding ServiceNow Reporting and Analytics. Extra attention will be given to ServiceNow’s Predictive Intelligence, Performance Analytics and Virtual Agent. Together, we decide what will add the most value for you.

02

Data quality check

Reliable data, facts and figures are essential for proper dashboarding and informed decision making. Our Master Data Readiness Check and subsequent actions clarify data ownership, integrations, and data sources—all to ensure high-quality data.

03

Build the dashboarding

We start building and implementing the analytics features. We make sure the dashboarding matches your organizational processes and deliver extra requirements, if any.

04

Train your people

Through workshops, we train your people to maintain and improve the data and dashboards themselves.

The best dashboards

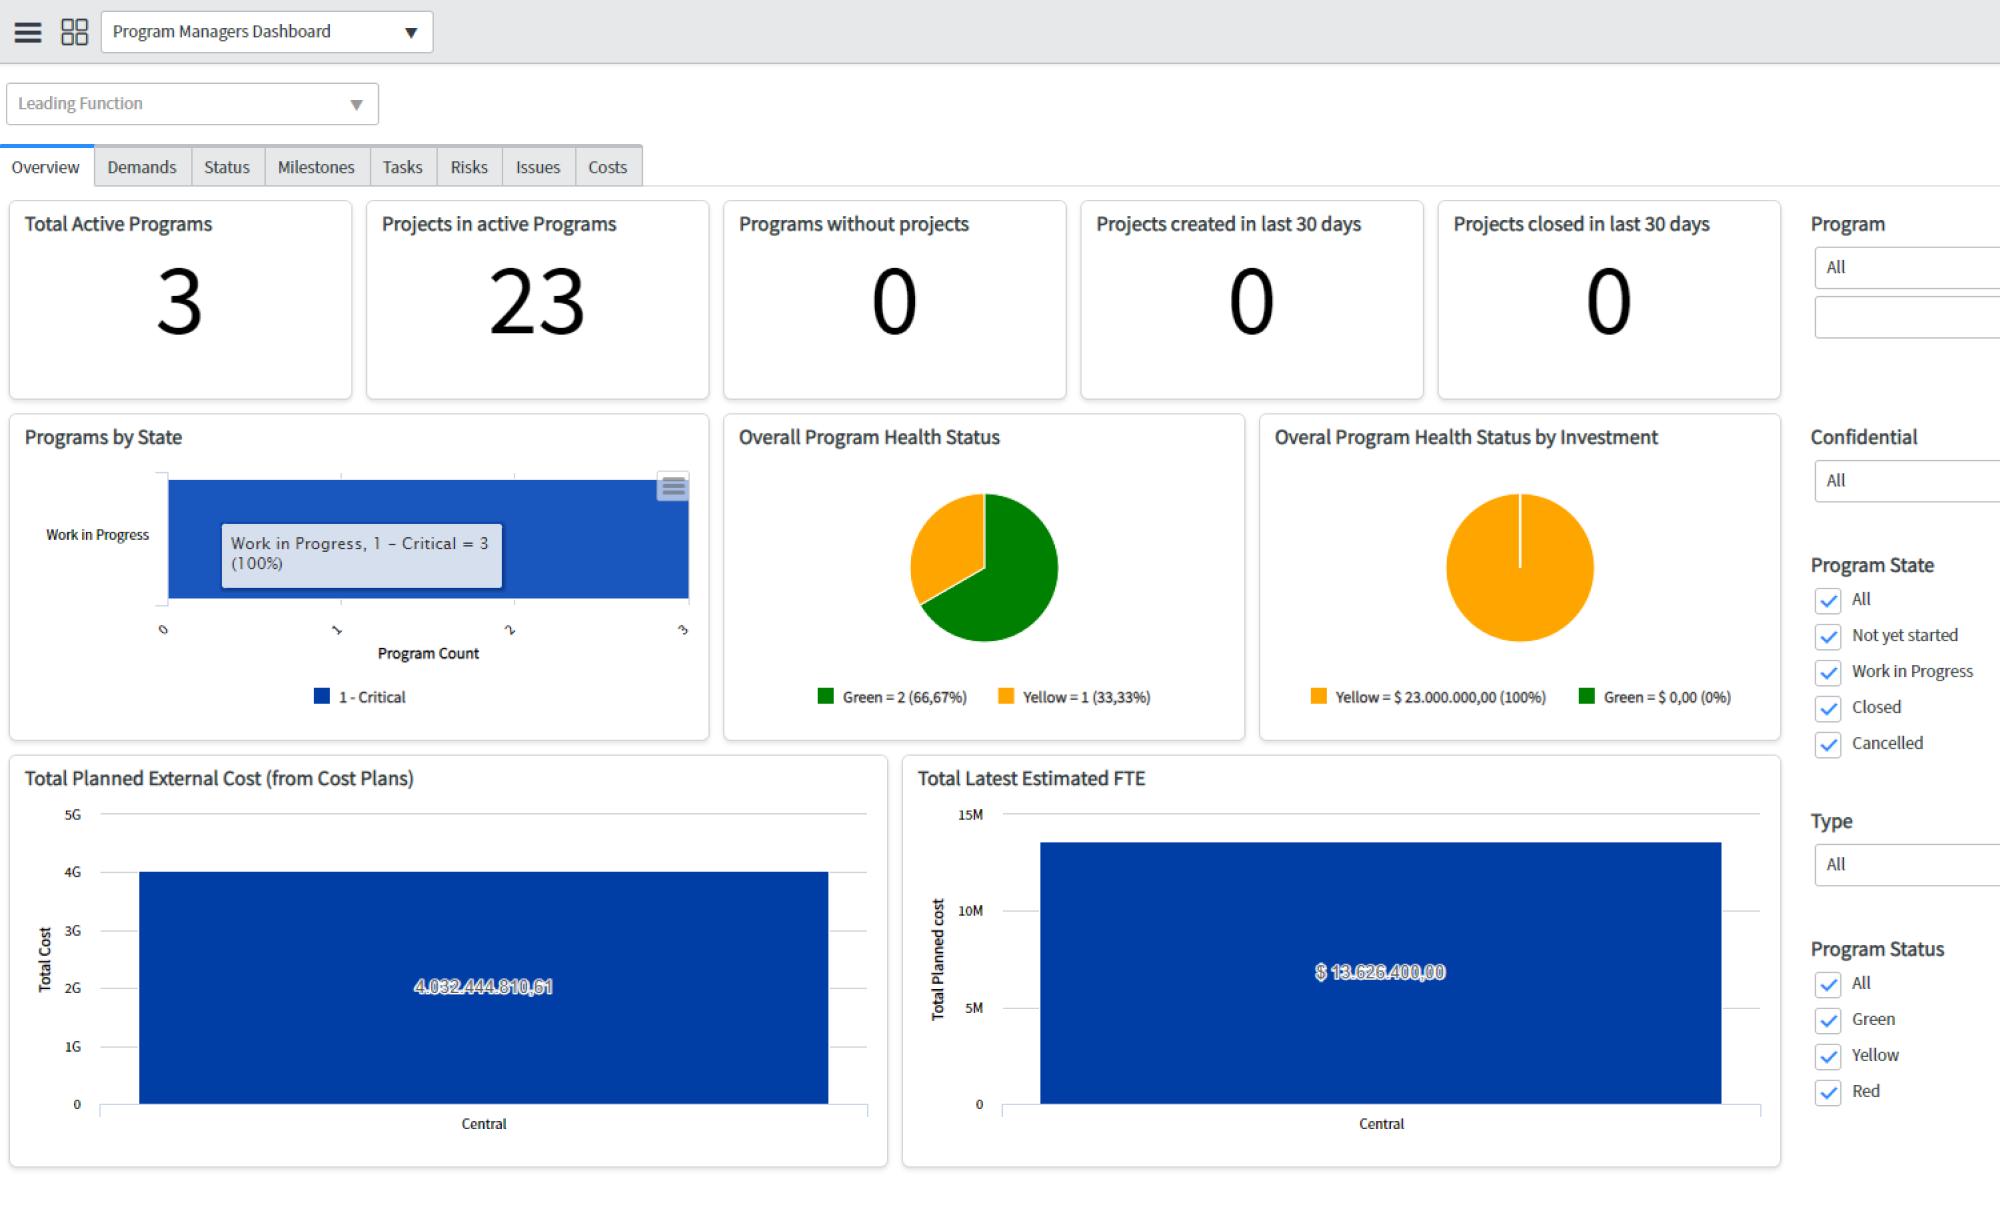
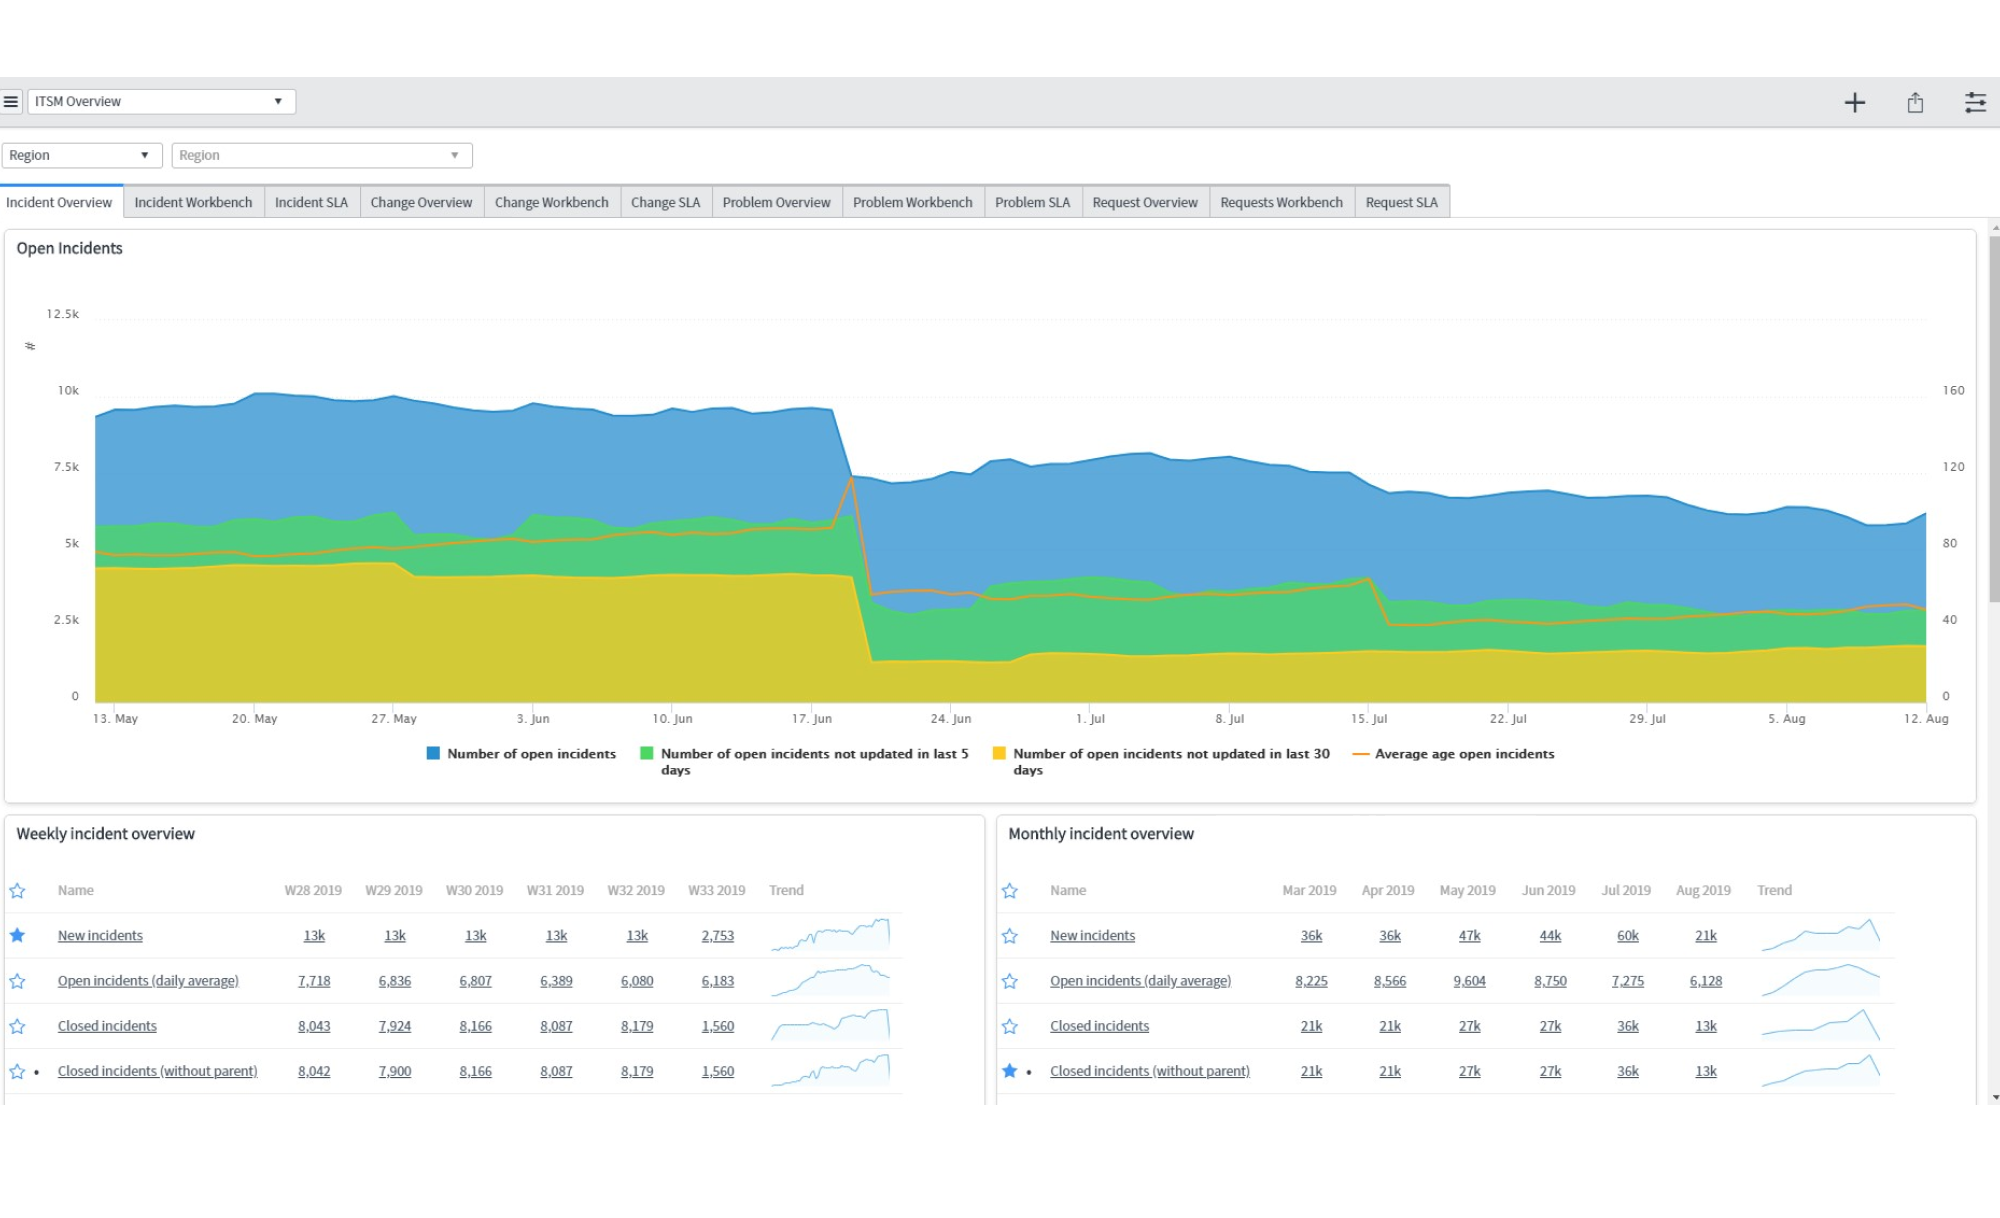
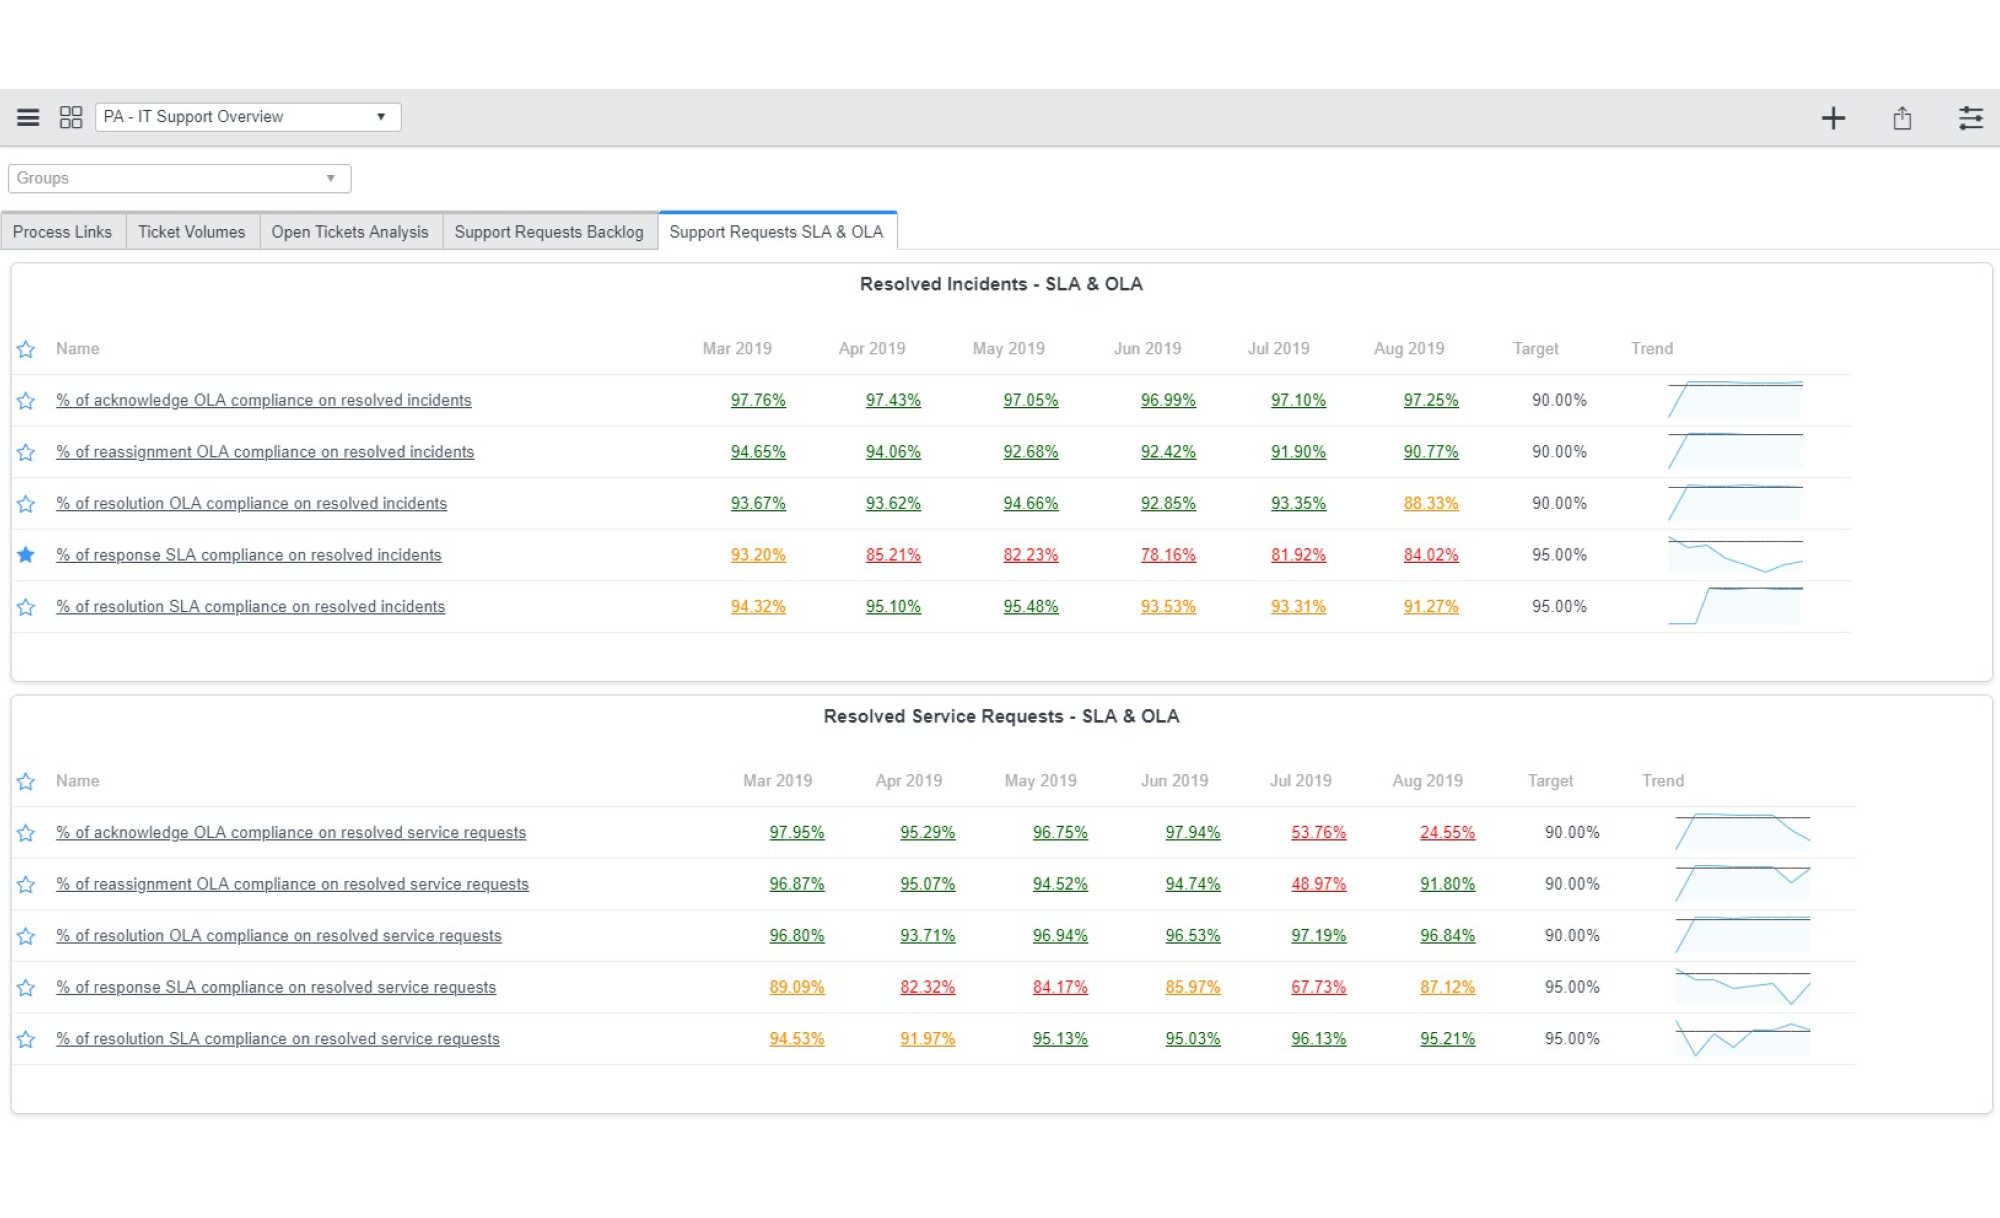
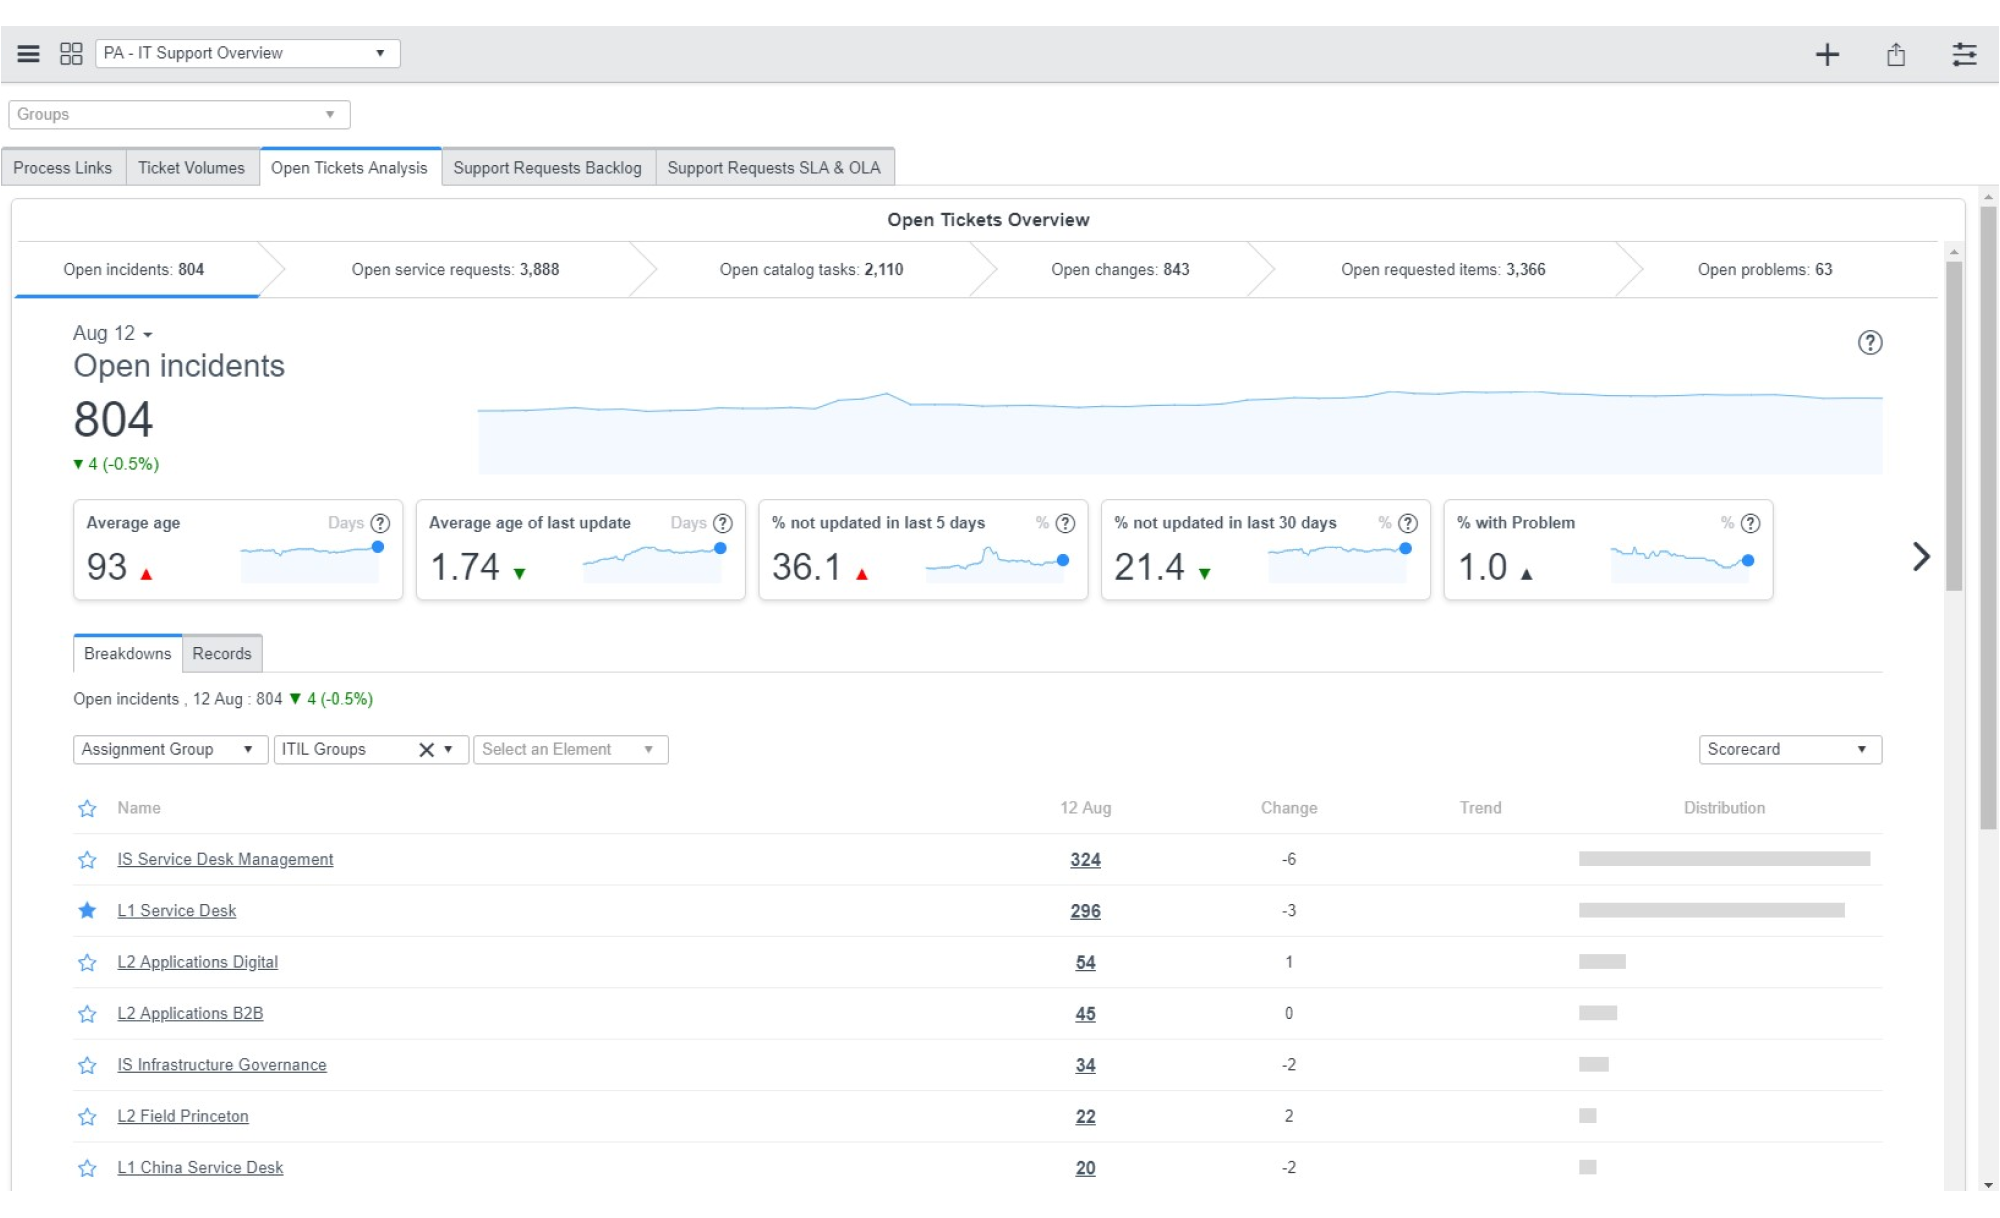
We have an impressive track record in building ServiceNow dashboards. We’ve listed just a few below, but we got many more. Contact us for more examples.

triangles circles

Don’t just take our word for it…

image

With the help of Plat4mation, we used AI to improve the User Experience by implementing Predictive Intelligence Classification.

Bamidele Layioye
IT Manager

FAQ

FAQs

What is the difference between Reporting and Performance Analytics?
Arrow Down

In short, Reporting is used to show the actual state of the records and Performance Analytics can be used to show trends made from historical data stored in snapshots and calculate new metrics using this data.

Why is data quality so important?
Arrow Down

Being able to make informed decisions starts with something very simple: making sure everyone fills in the required data fields. We’ve already helped dozens of organizations improve their data quality, so you’re in good hands if you need help with this.

Why let Plat4mation create your ServiceNow reporting and dashboards and not do it yourself?
Arrow Down

There’s a lot to know about ServiceNow data, processes and experiences to properly set up dashboards so you can make informed decisions. We’ve seen many customers base their decisions on the wrong KPIs and data. That’s why it is sometimes difficult to set this up properly without expert help.

waves

Talk to the expert

Schedule a call with one of our ServiceNow analytics experts. They’ll be happy to tell you more!

Talk to the expert